For Athletic Directors, Head Coaches & Strength Staff

Make Your Whole Roster Faster.

Origin Speed Training partners with high school and college programs in the Inland Empire to laser-test every athlete, educate your strength staff on velocity-based programming, and run in-season speed work that doesn’t cost you fresh legs on game day. Not just your fast kids — the entire roster.

Coached by two Upland High alumni who played NCAA Division I · Montclair, CA

In-season, this fallDean 5.22 → 4.86 In-season, this fallEJ 4.80 → 4.48 Right nowAll 19 athletes getting faster
Inside Origin · Montclair, CA
.15–.49sAverage 40 gain
in 3 months
Origin athlete database
19 / 19Tested athletes
improved
laser before/after dataset
~.10sOff the 40
per month
at 2 × 1 hr / week
+3″Average vertical
jump gain
every athlete · measured on the mat
10 / 20 / 40Laser splits on
every test
plus vertical
Who You’re Partnering With

Two Upland High Alumni.
Two D1 Careers.

We grew up playing in your league. We played Division I. And at 34 and 31 we still run the numbers we ask your athletes to chase — laser-timed, on the same system we’d run your team through.
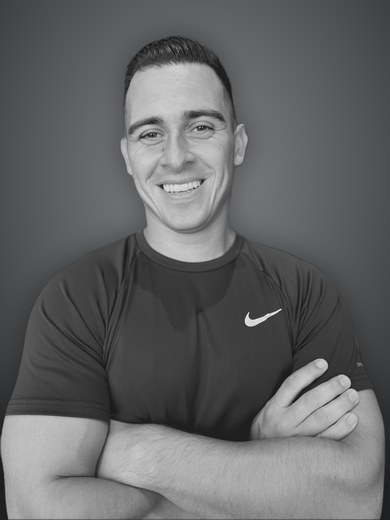
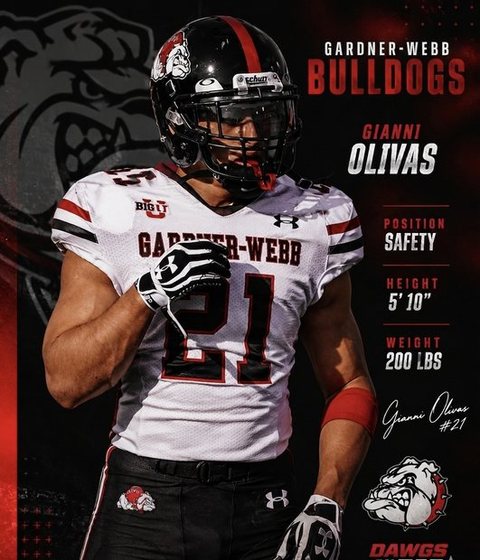
Gianni Olivas, Origin Speed Training co-founder Gianni Olivas playing safety at Gardner-Webb University

Gianni Olivas

Age 34
Co-Founder · Speed & Strength
4.54Laser 40 · 4.78 → 4.54 on the Origin system
  • Upland High School — CIF Champion, 2010
  • D1 FCS Safety, Gardner-Webb University — 3× All-American
  • Professional indoor football — Indoor Football League (IFL)
  • M.A. Education · B.S. Kinesiology — Exercise Science
  • 7 years HS football coaching — Varsity Defensive Coordinator, Freshman Head Coach, 2× League Champions
  • Trained D1 & professional athletes at Winner’s Circle Athletics (360+ hrs)
  • Built the velocity-based system behind every Origin program
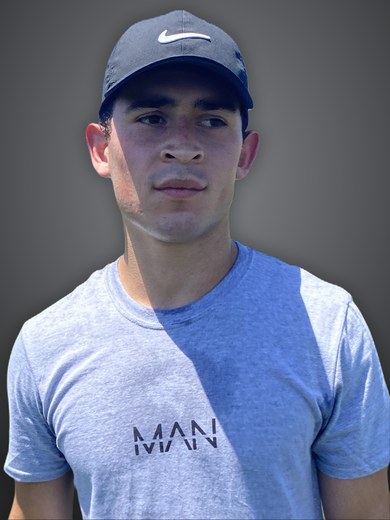
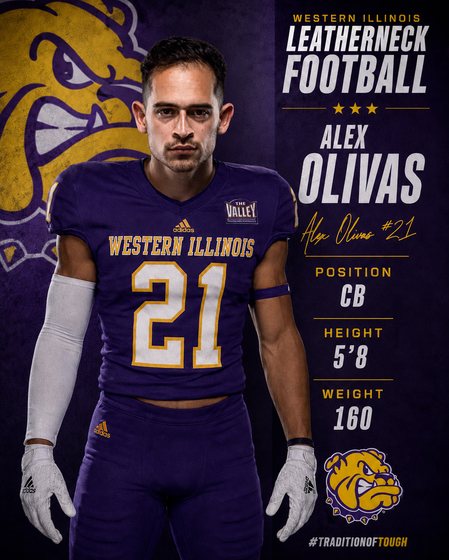
Alex Olivas, Origin Speed Training co-founder Alex Olivas playing cornerback at Western Illinois University

Alex Olivas

Age 31
Co-Founder · Speed Development
4.44Laser 40 · 4.70 → 4.44 on the Origin system
  • Upland High School — 22–4 overall varsity record
  • D1 Cornerback, Western Illinois University — Leatherneck Football
  • Competed in The Valley (Missouri Valley Football Conference)
  • A.A. Kinesiology · 5+ years sports performance training
  • Specialist in acceleration mechanics and change of direction
  • 5’8″ playing D1 corner — proof that size isn’t the ceiling
  • Coaches sprint mechanics, start technique and position-specific movement
Laser Verified · Your Coaches
We Run It Too

Local. Proven. Still Fast.

Both of us came through Upland High and the Inland Empire before playing D1 football. Your athletes are the kids we were — and we still run the 40 on the same OVR lasers we’d put your team through. That’s us in the clip with the OVR readouts on screen: Alex 4.44 and Gianni 4.57, at 31 and 34 years old. Gianni’s laser best has since dropped to 4.54 — you’ll find it on the facility leaderboard below.

We don’t coach it from a clipboard. We run the program, we test on it, and our numbers are on the same leaderboard as our athletes’.

Laser-Verified

Every Athlete Measured.
Every Test Saved.

No stopwatches, no hand times, no guessing. Every athlete runs through laser timing gates for 10, 20 and 40-yard splits, tests vertical on a jump mat, and gets a dated profile in the Origin coach database — so you and your staff see the trend for every kid on the roster.

10 yd

First step

Acceleration off the line — the split that decides a lineman’s first contact and a base-stealer’s jump. The split that leads the 40.

20 yd

Drive phase

The transition from pushing to upright sprinting. This is where mechanics show up — and where most high school athletes leak time.

40 yd + Vertical

Top speed & power

The number recruiters read, plus the vertical that predicts it. Both feed each athlete’s force–velocity profile and Origin Score.

Origin Speed Training leaderboard screen: laser-timed 40-yard dash personal bests, auto-ranked, with Origin Scores
The Origin Leaderboard runs live in our facility — laser-timed personal bests, auto-ranked, with an Origin Score (0–100) from our force–velocity engine. Partner programs get the same board for their own roster.
The Offer

A Free Combine Day
For Your Team.

We bring the lasers to you. Every athlete on the roster gets a verified 10, 20 and 40 plus a vertical — and your staff gets the report. No cost. No obligation. It’s the baseline, and if we work together it’s the number we’re measured against.

We set up on your turf

Laser gates and a jump mat on your field or in your gym. 50 yards of flat surface is all we need — we handle the rest.

Every athlete tests

10 / 20 / 40-yard laser splits and a vertical jump for the full roster. 25–60 athletes in about 2–3 hours, run like a combine.

You get the team report

Within 48 hours: every athlete’s splits, position-group averages, the roster distribution, and the athletes with the most speed left on the table.

We show you the plan

A short debrief with your staff on what the numbers say and what a 3-month roster gain would look like. Then it’s your call.

Available to high school and collegiate programs in the Inland Empire and greater Los Angeles area. We schedule around your practice calendar — pre-season, bye weeks and off-season all work.

In-Season Training

The Myth: “You Can’t Get Faster
During the Season.”

Every coach has heard it: speed is built in the summer, and the season is about holding on. Our athletes are disproving it right now. All 19 athletes currently in the program are getting faster in-season — practicing every day, playing every Friday — because their training is managed by velocity, not by volume. Dean and EJ are just two of the standouts.

Standout · in-season · laser-timed
5.224.86
Dean — −.36 on the 40 during his football season
Standout · in-season · laser-timed
4.804.48
EJ — −.32 on the 40 during his football season

Your kids don’t have to wait for the off-season.

Those are two standouts — but every one of our 19 current athletes is getting faster in-season, timed on the lasers, and adding 3+ inches to their vertical on average. The same model — bar-speed autoregulation, bridges instead of volume, two short speed exposures a week — is what we run for partner programs. Get faster now, not next summer.

Most programs choose between two bad options in-season: keep lifting heavy and bring tired legs to games, or shut it down and slowly give back the summer. Origin’s model is built on velocity — the bar tells us how fresh each athlete is, and the plan adjusts the same day.

Bar speed is the fatigue meter

Every working set is measured. If an athlete’s box squat moves slower than their target speed, the load drops for that session automatically — no grinding, no guessing. The Monday after a game takes care of itself. Athletes leave the weight room fresher than they walked in.

Bridges, not volume

A bridge is a short, high-velocity movement that converts strength an athlete already has into sprint output — weighted jumps done fast, banded jumps, Supercat jumps, heavy-resisted 10-yard runs. Micro-dosed in 15–25 minutes, they carry a low fatigue cost and a high transfer to the field.

Speed stays on the schedule

Two short exposures a week: timed flys and short resisted sprints, laser-timed so athletes see their number move mid-season. The dose is small on purpose — the nervous system gets the signal, the legs don’t pay for it.

Managed by the week

Sessions are placed against your practice and game calendar. Volume drops in rivalry and playoff weeks, a taper is built in before the games that matter, and every athlete is re-tested on a schedule — so your roster tests faster in November than it did in August.

MonVelocity check-in
+ bridges
20 min
TuePractice
WedResisted 10s
+ timed flys
25 min
ThuPractice
(walk-through)
FriGame day
fresh legs
SatFilm · recovery
SunOff

Sample football game week. Baseball and track schedules are built the same way around competition days and pitching workloads.

Staff Education

We Teach Your Staff.
We Build Your Program.

Football, baseball and track programming for your coaches and weight-room staff — built on a velocity-based approach, not percentage charts. Your staff learns the framework live, and leaves with a season template written for your equipment and your calendar.

Find every athlete’s optimal box squat

Box height is the lever most programs never touch — a 12″ box and a 20″ box are two different exercises. We use box height and bar speed to find where each athlete produces the most power, then wave the load across the month so the number climbs at the same speed. That’s the engine.

Bridges that flip the fast-twitch switch

25 lb weighted jumps done fast. Banded jumps. Supercat jumps with minimal knee bend. Heavy resistance on 10-yard runs, light resistance and overspeed for top speed. We have specific sequencing that recruits fast-twitch fibers first and expresses them at sprint speed — your staff will coach it live. The exact loading sequences stay in the program we build for you.

Sport-specific by design

Football: first step for linemen, top speed for skill positions, position-group testing. Baseball: 60-yard speed, base-stealing acceleration and rotational power without loading the arm. Track: fly work, block starts and peaking weeks.

Coach App Access

Your coaches get the app — and a direct line to us.

Partner coaches get access to the Origin Speed Program app (originspeedprogram.com): every workout and session template, the load calculator that prescribes working weights from bar speed, athlete profiles and test history — and coach chat, so your staff can ask us a question in real time, on the weight-room floor, and get an answer from the people who built the system. We’re not a clinic that leaves; we’re in your pocket all season.

  • Every workout in the app — sessions, phases and templates your staff can run day one
  • Load calculator — working weights prescribed from bar speed, no percentage charts
  • Athlete profiles & test history — laser splits, verticals, Origin Score, dated
  • Real-time coach chat — ask us mid-session, get a coach’s answer
  • Form videos on every movement so cues stay consistent across your staff

What your staff walks away with

A 2–3 hour on-site clinic with a live athlete session · a testing protocol and re-test cadence · an off-season / pre-season / in-season / playoff template configured to your racks, bars and space · coach access to the Origin Speed Program app and coach database for your roster · a 30-day follow-up with our coaches.

Velocity box squatLoad prescribed from bar speed, box height tuned to the athlete.
Resisted 10sRope resistance on the lot — heavy in accumulation, light for top speed.
Supercat jumpsFast, minimal knee bend — the bridge from strength to sprint.
Jumps & vertical testingWeighted jumps done fast, verticals measured every test.
Roster Model · Football

Varsity Football High School
Roster Sample

50 athletes, 3 months — a look at what our programming can potentially do for a full roster. Today reflects typical laser-timed ranges by position (laser runs about .2 slower than a hand time). After 3 months applies Origin’s documented gain range — .15 to .49 — the way it plays out in our database: the slower the athlete, the bigger the gain.

Team average 40
5.164.86−0.30s
today → after 3 months
Athletes under 4.80
823+15
today → after 3 months
Avg. top speed (est.)
19.0 mph20.1 mph+1.1
today → after 3 months
Roster distribution · laser 40 (yd)
TodayAfter 3 months
4.4s4.6s4.8s5.0s5.2s5.4s5.6s5.8s

It’s not just the fast kids.

Your linemen gain the most — four tenths off the 40 is a different first step off the ball. Your linebackers pursue faster. Your quarterback escapes. Twenty-three athletes under 4.80 instead of eight is an entire on-field speed advantage your opponents can’t recruit their way around — it comes from the whole roster, not the two kids who were already fast.

QB5.19 → 4.85−0.34s avg
RB4.84 → 4.62−0.22s avg
WR4.85 → 4.64−0.21s avg
TE5.04 → 4.77−0.27s avg
OL5.68 → 5.23−0.45s avg
DL5.39 → 5.02−0.37s avg
LB5.09 → 4.81−0.28s avg
DB4.83 → 4.62−0.21s avg
K/P5.14 → 4.84−0.30s avg
#Pos10 yd20 yd40 ydEst. MPHΔ 40
1QB1.823.055.2019.0−0.34s
2QB1.803.065.2418.8−0.36s
3QB1.792.995.1419.0−0.32s
4RB1.742.904.9220.3−0.22s
5RB1.732.824.8919.8−0.27s
6RB1.692.784.7221.1−0.17s
7RB1.692.804.8120.4−0.22s
8WR1.692.764.7820.3−0.23s
9WR1.722.844.9419.5−0.22s
10WR1.722.834.8820.0−0.24s
11WR1.682.714.7320.3−0.16s
12WR1.772.895.0319.1−0.28s
13WR1.702.844.8820.1−0.23s
14WR1.642.734.7220.6−0.15s
15TE1.772.874.9919.3−0.27s
16TE1.782.905.0419.1−0.25s
17TE1.782.995.1019.4−0.29s
18OL2.033.405.8616.6−0.46s
19OL1.953.345.7017.3−0.46s
20OL1.933.225.5917.3−0.41s
21OL1.923.215.5517.5−0.43s
22OL1.873.135.4217.9−0.38s
23OL2.043.485.9316.7−0.49s
24OL2.013.425.8217.0−0.49s
25OL1.983.305.6717.3−0.47s
26OL1.963.265.6317.3−0.45s
27OL1.943.285.5917.7−0.42s
28DL1.783.055.1819.2−0.29s
29DL1.823.045.2518.5−0.34s
30DL1.913.185.4617.9−0.36s
31DL1.873.155.3318.8−0.34s
32DL1.823.085.3018.4−0.38s
33DL1.943.255.5617.7−0.40s
34DL1.863.095.3118.4−0.36s
35DL1.953.295.6917.0−0.45s
36LB1.692.874.9120.1−0.21s
37LB1.783.025.1519.2−0.33s
38LB1.812.995.1918.6−0.28s
39LB1.792.965.1418.8−0.32s
40LB1.742.955.0319.7−0.27s
41LB1.762.985.1019.3−0.27s
42DB1.662.804.7720.8−0.21s
43DB1.682.754.7320.7−0.17s
44DB1.682.774.7720.5−0.22s
45DB1.732.864.9219.9−0.24s
46DB1.672.824.8120.6−0.20s
47DB1.662.764.7920.2−0.22s
48DB1.692.884.8920.4−0.21s
49DB1.702.854.9319.7−0.21s
50K/P1.773.005.1419.1−0.30s

Sample roster for illustration. Individual results depend on attendance and starting point; every athlete who completes an Origin block has gained at least .15 on the laser to date.

Roster Model · Baseball

Varsity Baseball High School
Roster Sample

24 athletes, 3 months — the same model applied to a baseball roster. In baseball the 40 translates: .27 off the 40 is roughly .35 off the 60 — the difference in a scout’s notebook, an extra base on a gap shot, a stolen bag in a one-run game.

Team average 40
5.014.74−0.27s
today → after 3 months
Athletes under 4.80
217+15
today → after 3 months
Avg. est. 60-yard
7.276.92−0.35s
today → after 3 months
Roster distribution · laser 40 (yd)
TodayAfter 3 months
4.4s4.6s4.8s5.0s5.2s5.4s5.6s5.8s
P5.16 → 4.84−0.32s avg
C5.13 → 4.82−0.31s avg
IF4.92 → 4.68−0.24s avg
OF4.82 → 4.62−0.20s avg
#Pos10 yd20 yd40 ydEst. MPHEst. 60 ydΔ 40
1P1.843.075.3218.27.69−0.38s
2P1.843.065.2318.97.57−0.35s
3P1.843.125.3318.57.70−0.38s
4P1.742.864.9619.57.21−0.27s
5P1.712.884.9619.77.21−0.26s
6P1.722.844.9419.57.19−0.26s
7P1.853.055.2618.57.61−0.33s
8P1.803.045.2518.57.60−0.33s
9P1.833.025.2218.67.56−0.33s
10C1.813.025.1918.97.52−0.32s
11C1.752.975.0619.67.34−0.30s
12IF1.692.844.8620.37.08−0.25s
13IF1.672.804.8020.57.00−0.24s
14IF1.722.804.8420.17.05−0.21s
15IF1.752.914.9919.77.25−0.25s
16IF1.782.915.0219.47.29−0.29s
17IF1.792.915.0419.27.32−0.25s
18IF1.712.834.9119.77.15−0.23s
19OF1.742.834.9119.77.15−0.26s
20OF1.652.744.7520.46.93−0.16s
21OF1.682.794.8420.07.05−0.21s
22OF1.712.854.8620.47.08−0.24s
23OF1.682.864.8620.57.08−0.18s
24OF1.642.754.7220.86.89−0.17s

Estimated 60-yard time derived from the laser 40. Pitchers train the same speed and power system with arm-care loading built into the template.

Partnership Options

Start Free.
Scale When the Numbers Say So.

Every partnership starts with the free combine day. From there, most programs bring us in for a staff clinic and decide on a season partnership once the first re-test comes back.

Step 1

Free Combine Day

$0no obligation
  • Laser 10 / 20 / 40 + vertical for the full roster
  • Team report within 48 hours
  • Position-group averages & roster distribution
  • Staff debrief on what a 3-month gain looks like
Schedule a Combine Day
Step 2 · Most Popular

Staff Clinic

$1,000per clinic · invoiced to the school
  • 2–3 hour on-site clinic for coaches & weight-room staff
  • Live athlete session: box squat, bridges, resisted runs
  • Season template configured to your equipment (football, baseball or track)
  • Testing protocol + re-test cadence
  • Coach access to the Origin Speed Program app — workouts, load calculator, real-time coach chat
  • 30-day follow-up with our coaches
Book a Clinic
Step 3

Season Partnership

Customper team · per season
  • Monthly laser re-tests with team reports
  • In-season programming managed by velocity
  • Origin coach database & leaderboard for your roster
  • Full app access for coaches and athletes
  • Real-time coach chat with Alex and Gianni all season
Talk to Us
Funding it: Most programs pay for the clinic from coaching stipends, ASB / booster budgets or PE department funds. We invoice the school, district or booster club directly and keep a W-9 on file — no personal cards, no hassle.
Let’s Set It Up

Give Your Program
The Speed Advantage.

Text or call either of us, send an email, or DM the gym. We’ll get your free combine day on the calendar this season.

Origin Speed Training · 5052 W Mission Blvd, Montclair, CA 91762 · originspeedtraining.com